Analyzing Results
Viewing and Interpreting Survey Responses

Understanding and analyzing your survey responses is crucial to extracting meaningful insights. With Survia, this process is straightforward thanks to the Results and Summary tabs on the Results page. Let’s explore how to use these features effectively.
Results Tab: Viewing Individual Responses
The Results tab allows you to view each response individually, offering a detailed look into how participants answered your survey.
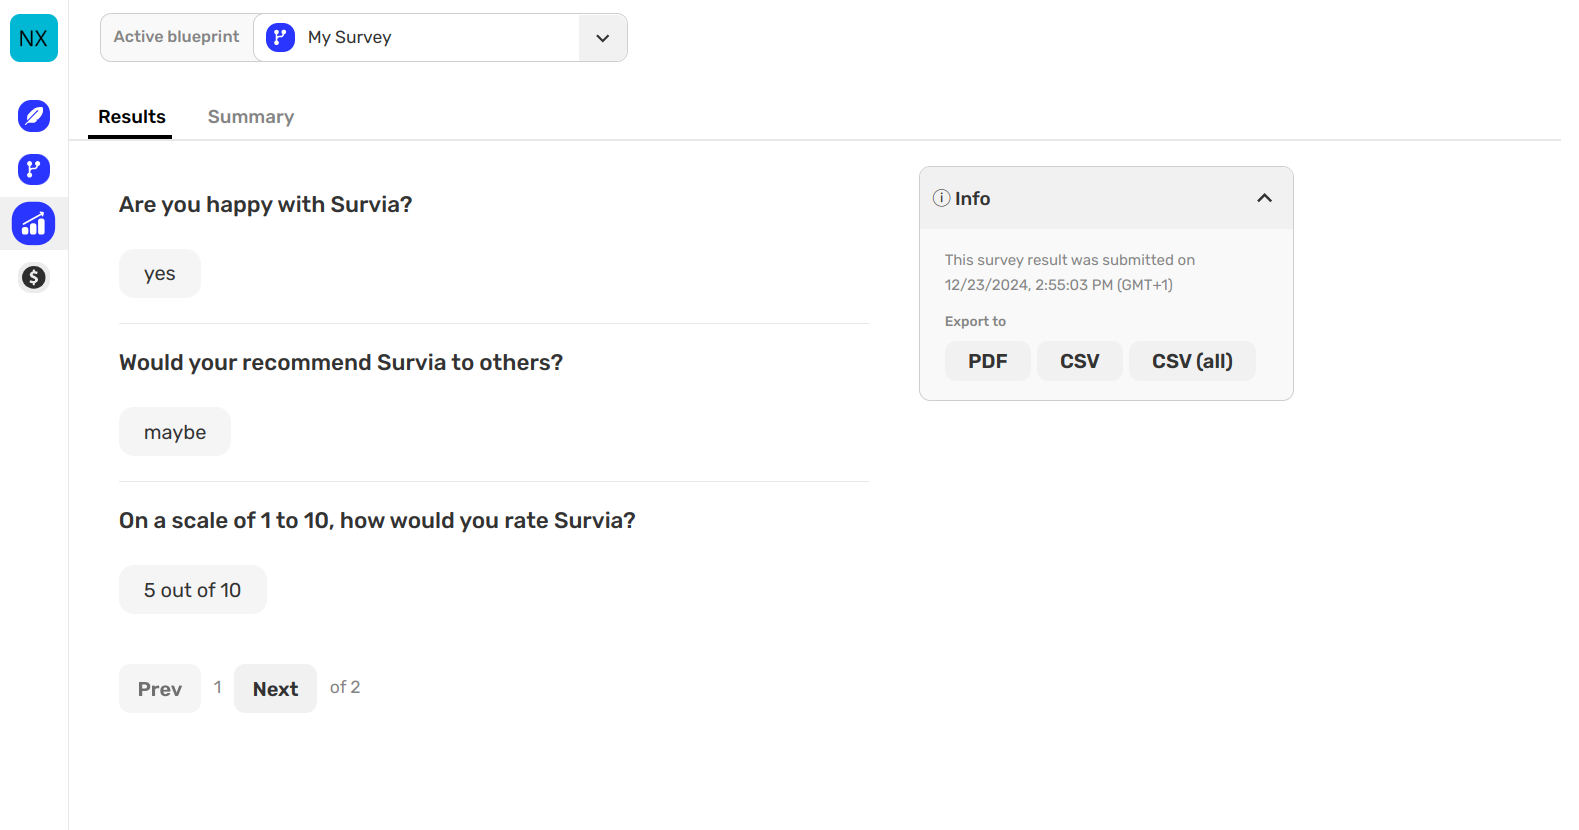
You can navigate between responses using the Prev and Next buttons and see responses one at a time.
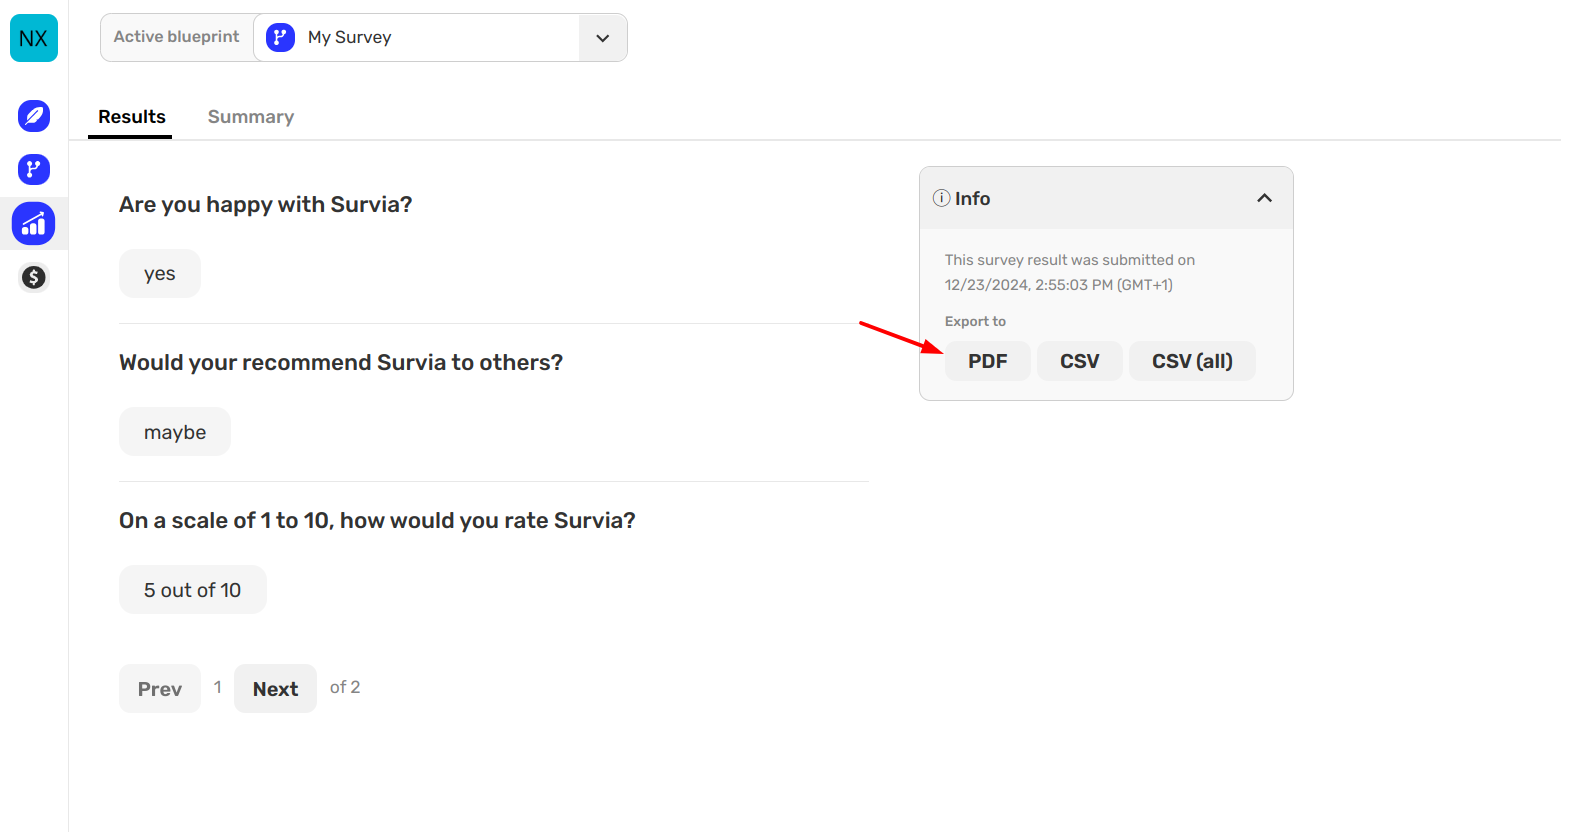
Once you’ve reviewed the data, you can download it in PDF or CSV format for further analysis.
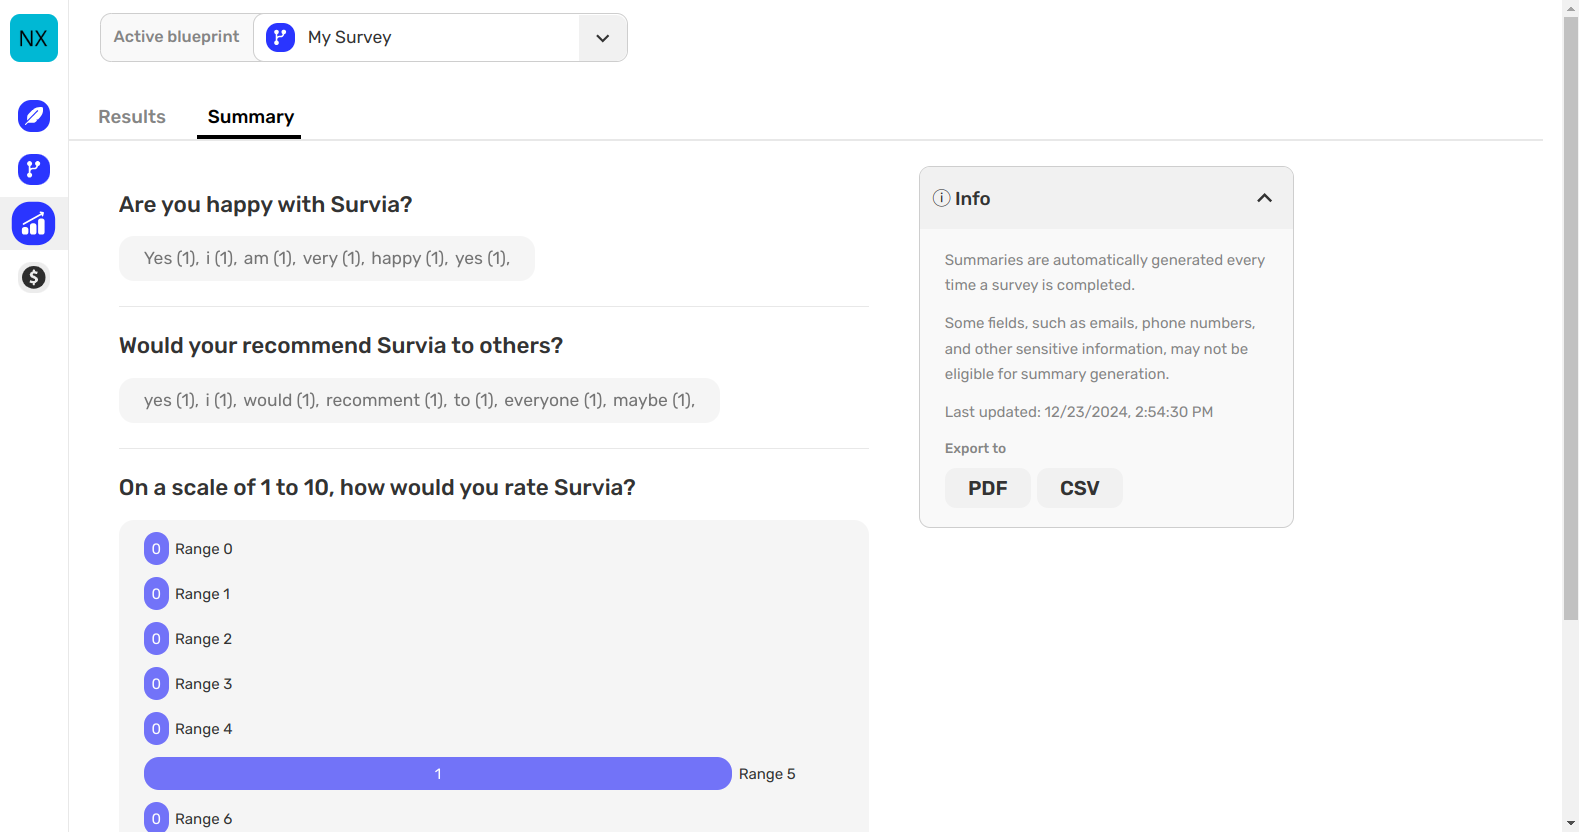
Summary Tab: Viewing Aggregated Data
The Summary tab provides a high-level overview of all the survey responses, helping you identify trends and patterns. Here’s an example of what you might see:
Question: Are you happy with Survia?
- Yes (1)
- I (1)
- Am (1)
- Very (1)
- Happy (1)
- Yes (1)
Question: Would you recommend Survia to others?
- Yes (1)
- I (1)
- Would (1)
- Recommend (1)
- To (1)
- Everyone (1)
- Maybe (1)
Question: On a scale of 1 to 10, how would you rate Survia?
- 0 Responses: Range 1
- 0 Responses: Range 2
- 0 Responses: Range 3
- 0 Responses: Range 4
- 1 Response: Range 5
- 0 Responses: Range 6
- 0 Responses: Range 7
- 0 Responses: Range 8
- 0 Responses: Range 9
- 1 Response: Range 10
The Summary tab simplifies data interpretation, making it easier to spot trends or common responses.
Why Use Both Tabs?
The Results tab helps when you want to focus on individual responses. The Summary tab is perfect for identifying patterns and general trends. Together, these tools provide a comprehensive view of your survey data.
If you have any questions about analyzing your survey results, feel free to reach out to us at hi@survia.io.
Happy analyzing!